When things like this happen, it's natural to look at the short-term price action and try to figure out what will happen next based on the most recent diplomatic news. That makes sense, but it's probably not the best thing to do right now. What matters more in these cases is getting a better idea of how similar crises ended in the past, how long it took for energy markets to really stabilise after the political trigger was removed, and what long lasting changes those crises caused. The Yom Kippur War and Arab oil embargo of 1973, the Iran-Iraq War from 1980 to 1988, and Russia's invasion of Ukraine in 2022 are three historical conflicts that are most similar. They don't tell a simple or comforting story, but they do tell an honest one, and they point to three different ways we can move forward. This article goes through each one in turn, figures out which one is most likely, and gives its opinion on which one would be best for the markets.

The Yom Kippur War and Arab Embargo (1973 to 1974)
People often use the 1973 crisis to explain what's going on now, and for good reason. On October 6, 1973, Egypt and Syria attacked Israel without warning. The US backed Israel, and OAPEC responded with an oil embargo that sent prices to levels that no one had thought possible. The cuts made the price of oil go up from $2.90 a barrel before the embargo to $11.65 a barrel by January 1974 Federal Reserve History. The History of the Federal Reserve Gas stations ran out of gas all over Europe and the US. The governments got scared. It turned out that macroeconomic assumptions that had been true for a generation were wrong almost overnight.
What is important to be clear about, is that the 1973 disruption was mostly political, not physical. Producers decided to hold back supply as a way to get what they wanted. The Strait of Hormuz was never closed. When you think about how quickly things can change, that difference is very important. The embargo didn't end because of military force, strategic reserve releases, or different supply routes. It ended because diplomacy found a way for everyone to leave politics without losing face. Henry Kissinger spent months on shuttle diplomacy, working on two fronts at once: negotiating with Arab oil ministers about the embargo and with Egypt, Syria, and Israel about the military situation. The First Egyptian-Israeli Disengagement Agreement of January 1974 was not a final peace deal, but it was enough to convince the parties involved to lift the embargo in March 1974 U.S. Department of State.
This is the part that should make markets think twice. The Yom Kippur War ended on October 26, 1973, less than three weeks after it started. The embargo lasted for five more months after that. And the higher prices that the crisis caused stayed in place long after the embargo officially ended. They stayed high until the late 1970s and only started to go down steadily after 1981. One thing that is very important but not often talked about is that oil prices never went back to where they were before the embargo. The fight was over. The price did not go back to where it was before.
In 1973, European and UK markets changed in ways that shaped energy policy for a whole generation. By 1970, more than 55% of Western Europe's energy came from imported oil. The shock showed that governments had let a structural dependency grow as coal industries were slowly shut down in favour of cheap Middle Eastern crude EBSCO. The UK sped up development in the North Sea, which gave it some protection that most Continental European economies did not have. The crisis led directly to the creation of the IEA, which shows how big the structural rethink that followed was.
At first glance, the Iran-Iraq War seems like a good example of the opposite. For eight years, two major oil producers fought each other, and attacks on tankers and oil infrastructure were a regular part of the conflict. Despite this, the effect on global oil prices was surprisingly small. A lot of people thought that the Iran-Iraq War and the Tanker War that came after it would have a big effect on oil prices around the world, but they didn't. In the first six months of the war, oil prices went up by about 11%. After that, they stayed about the same or went down.
The reason for that relative stability is also the reason the Iran-Iraq example is not a good way to comfort today's markets. During the Tanker War, only 1 to 2% of merchant traffic through the Strait was attacked. Shipping exports from the Gulf stayed open and flowing throughout the war. The Washington Examiner said that the chokepoint was never closed. The main difference between the 1980s and now is that traffic in the Strait of Hormuz hasn't just slowed down; it's basically stopped. That is a completely different situation, and using the Iran-Iraq model to deal with the current crisis is a mistake.
The war ended in 1988 because both sides were tired of fighting and agreed to UN Resolution 598 after eight years of stalemate that left the map unchanged and both countries' economies in ruins. The structural legacy for oil markets was real, though: OPEC fell apart, Iran and Iraq lost production capacity for years, and Saudi Arabia became the dominant swing producer for the next ten years. In the middle of the 1980s, oil prices fell below $15 per barrel. This didn't happen because the crisis was over in any meaningful way; it happened because the global market just adjusted and found other sources of supply.
The most recent example is Russia's invasion of Ukraine in February 2022. This is the most directly useful example for European and UK markets, even though the way it disrupted things is different from the current Hormuz crisis. After the invasion, Russia stopped sending 80 billion cubic meters of pipeline gas to Europe, which caused an energy crisis in the region. From 2018 to 2021, Russia supplied more than 40% of the EU's gas needs. By 2023, that number had dropped to about 10% as pipeline deliveries fell and the US became the EU's largest LNG supplier iea.
The response to the price was amazing. In August 2022, the price of petrol in Europe hit an all-time high of 300 euros per megawatt hour. In 2020, the price was only about 20 euros. Review of Public Policy at LSE The Russia-Ukraine crisis was different from the one in 1973 in a big way: it was solved through substitution instead of diplomacy. Europe didn't talk its way out of needing Russian gas. It just found more gas, built more renewable energy sources, and cut down on industrial use faster than most people thought it could. The price normalisation took a while, and high energy costs stayed high for most of 2023. However, the structural reconfiguration of European energy supply happened very quickly. Moreover, the UK was somewhat insulated from the Russia-Ukraine crisis compared to Continental Europe because it relied less on Russian gas before the war and was more exposed to Norwegian pipeline supply. However, that relative insulation doesn't work as well in the 2026 Hormuz crisis, as the next section shows.
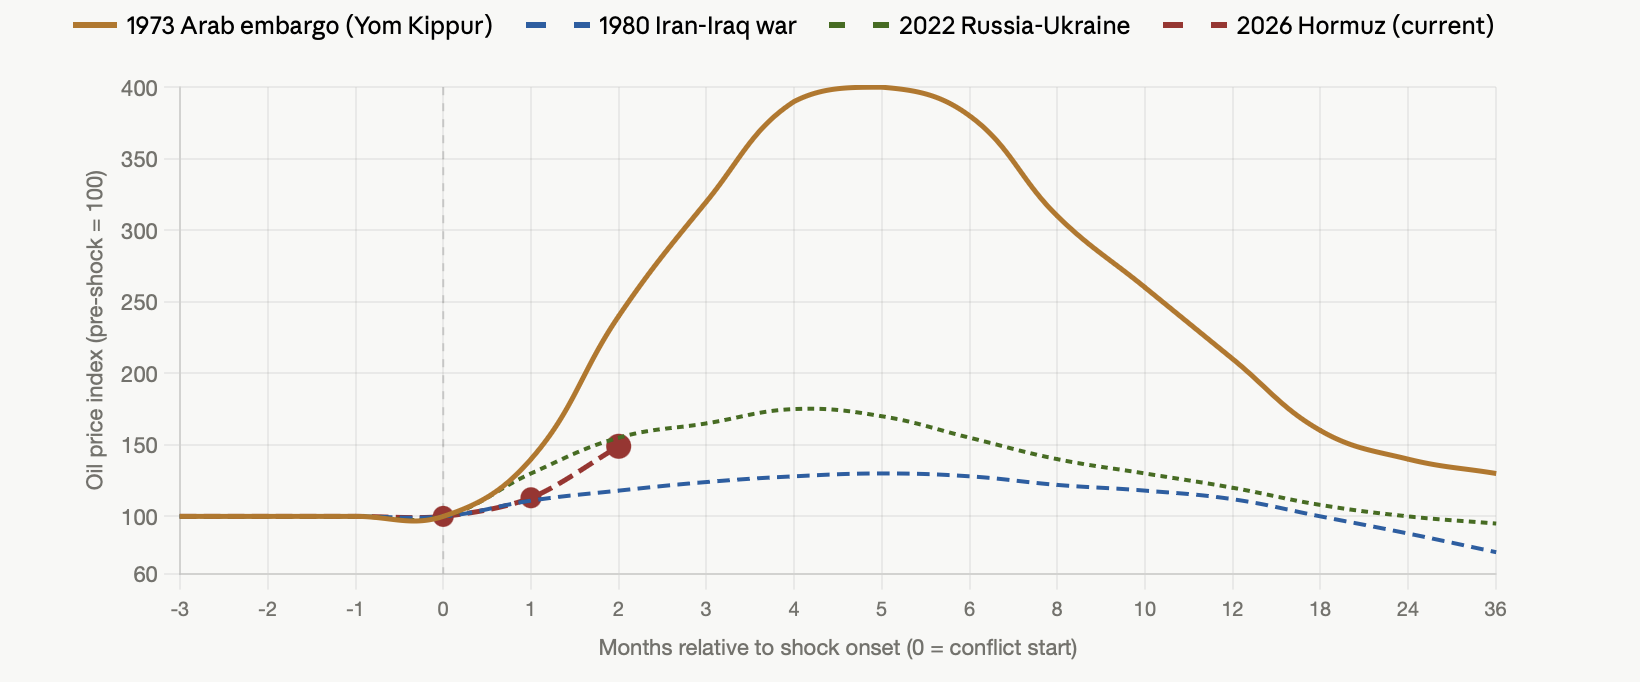
The four episodes are all shown on the same indexed scale in Figure 1 below, with oil prices set at 100 at the level before the shock. The 1973 line is very different from everything else. Its price index peaked at almost 400, and it took almost a decade for it to recover. The Iran-Iraq line doesn't move much at all, which is the point. The 2026 line is short because it only shows confirmed data. The path from the current reading of about 150 is exactly what the resolution pathways section below is about.
One thing that gets lost in commentary that treats European energy exposure as broadly uniform is that the UK and the EU actually face quite different vulnerabilities depending on which crisis you are looking at. The two crises that are most important to European markets right now are the Russia-Ukraine conflict in 2022 and the current Hormuz disruption. These two events have almost opposite effects on the UK and the Continent, and that matters for positioning.
LNG is the main way that Europe is affected by the current crisis. Gas storage levels were at their lowest in history when Europe entered 2026. At the end of February, there were only 46 billion cubic meters of gas stored, down from 77 billion cubic meters in 2024. The closed Strait has disrupted Qatari and Emirati LNG flows, forcing Europe back into the brutal spot market competition it faced in 2021 and 2022. Europe has to compete with Asian buyers for flexible LNG cargoes on the spot market. This happened during the 2021 to 2023 energy crisis, and it is raising petrol prices in Europe in ways that hurt the competitiveness of businesses in Germany, Italy, France in particular and Germany, which was still dealing with the long-term effects of moving its energy resources after Russia, the timing of a second gas shock in a row is very bad.
The UK's specific vulnerability is different and not given enough attention in the wider European coverage of the crisis. The UK is the most vulnerable European country right now because Kuwaiti refiners control a large part of its jet fuel supply. Ryanair CEO Michael O'Leary has warned that 5 to 10% of flights could be cancelled this summer if the Strait of Hormuz stays closed. The closing of the Grangemouth refinery in Scotland in 2025 took away a significant part of the country's fuel supply resilience at the worst possible time. Emergency reserves can be used up and new suppliers can be found for crude oil over the course of several weeks. Refined product supply chains, on the other hand, are much less flexible. There is no simple mechanism for replacing Kuwaiti jet fuel grades with oil from inland strategic reserves.
The North Sea question always comes up in these talks: giving out more drilling licenses on the UK Continental Shelf won't help UK consumers during the current crisis because it takes years to bring new production to market, and most UK oil is sold to international markets at global prices, no matter where it was extracted ukerc. It's important to say this clearly because it tends to cause more political heat than analytical light.
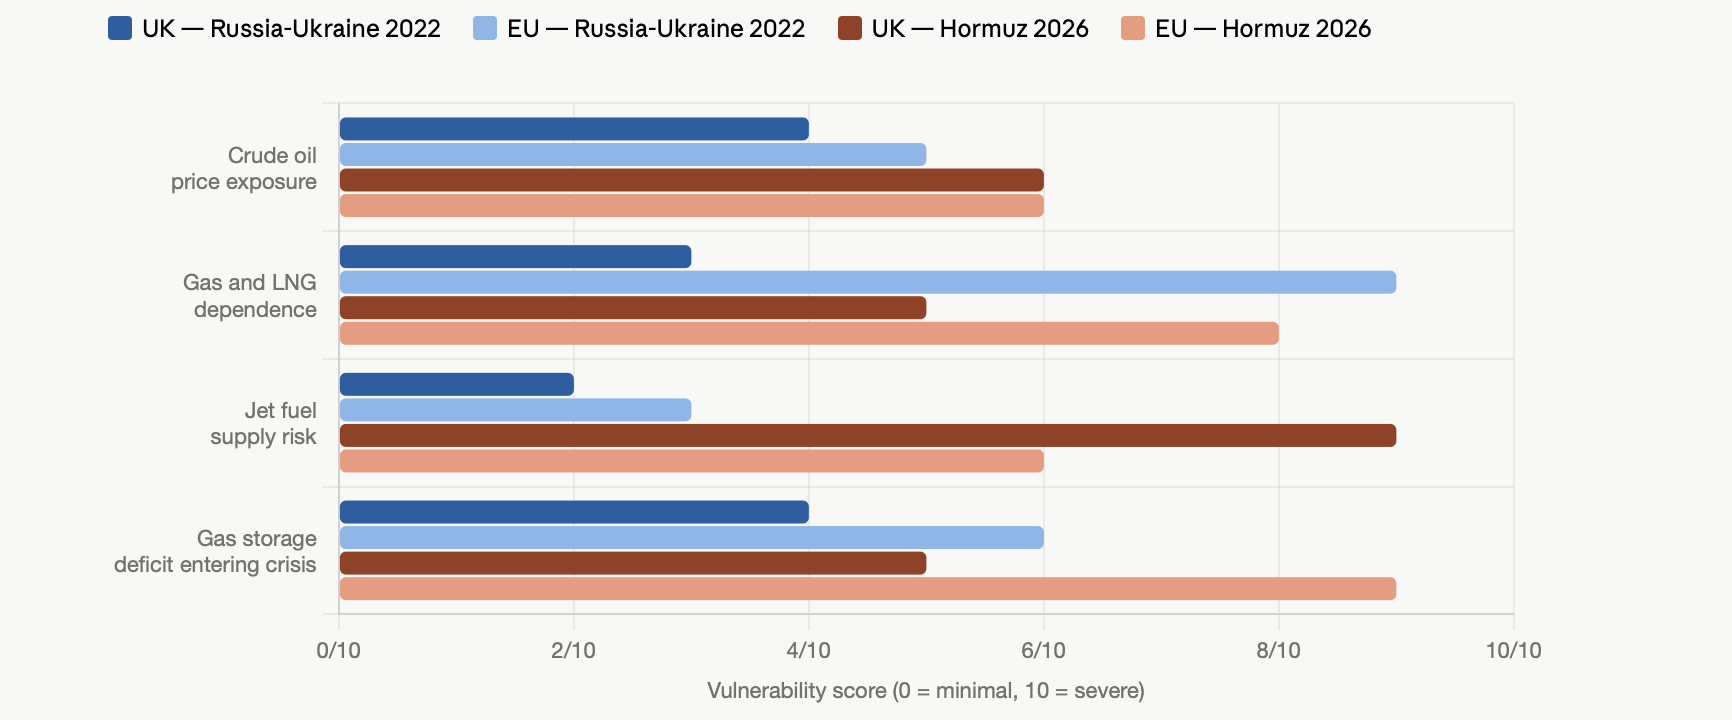
Figure 2 highlights how vulnerable the UK and Europe are in four energy areas during the crises of 2022 and 2026. The maps use a simple 0 to 10 scale based on the sources cited in this article. The profiles that are different from each other are really striking. In 2022, the EU is very dependent on petrol, while the UK is relatively protected from that shock. However, in 2026, the situation changes for jet fuel exposure, with the UK's heavy reliance on Kuwaiti refining output making it vulnerable.
Based on all three historical examples, there are three possible ways to solve the current crisis. These ways are very different in terms of what they mean for short-term prices and long-term market dynamics.
The first is a quick diplomatic solution, like the 1973 Kissinger model, where targeted diplomacy creates a way for Iran to reopen the Strait without having to give up anything politically important. Oman and Qatar are still the most likely middlemen. The most important thing to learn from 1973 is that the possibility of a negotiated end to hostilities, even without a final peace deal, was enough to get the parties involved to lift their restrictions U.S. Department of State. All parties found a framework that let them stop the economic damage without conceding their core political positions, and a similar dynamic is imaginable today. On this template, spot Brent retraces toward the $65 to $75 range by late 2026, but a structural risk premium remains embedded in the forward curve for considerably longer because, again, 1973 is clear that oil prices never return to where they were.
The second path is a long conflict with the market slowly adapting, which is the model from the 1980s. The global market grows around the chokepoint over the course of 12 to 24 months thanks to faster US production, new trade routes, and more Saudi pipeline bypass capacity. However, there is still no clear geopolitical solution. Prices stay high, between $85 and $100, for longer than anyone wants. This situation is going to cause real and long-lasting pain for Germany and the rest of Europe's industrial base. High LNG prices make the energy cost disadvantage even worse, which has been quietly driving deindustrialisation for several years.
The third pathway is based on the Russia-Ukraine experience. It is more of a structural consequence than a resolution scenario: an accelerated energy transition that happens not through diplomacy but through political momentum created by a series of energy crises. Europeans no longer trust global fossil fuel supply chains because of the wars in Ukraine and Iran. The inflation and shortages caused by these two wars are making people less resistant to the renewable energy buildout that governments have been promising for years. In the short term, this path will hurt, but in the medium term, it will lead to a faster decrease in our reliance on fossil fuels, which is what makes these crises so bad in the first place.
I honestly think that Pathway Three is not just one possible way to solve the problem, but an unavoidable structural result of this crisis, no matter how quickly the Strait reopens. This is similar to how REPowerEU became an unavoidable structural result of 2022, no matter how that war ends. David Miliband, the UK's Energy Secretary, has already made this point clear, using Hormuz as proof that renewable energy produced in the UK is the only long-term way to achieve energy independence. There is a lot of historical evidence to support that argument. It is structurally the same as the one that led to North Sea development after 1973.
For FICC positioning, the past events all point to one conclusion: the immediate spot-price shock from the current disruption will probably start to ease off in Q2 and Q3 2026 as some Strait transit returns to normal. However, the market is unlikely to return to its pre-crisis equilibrium. Instead, a structural risk premium of about $10 to $20 per barrel above pre-shock levels is likely to stay in the forward curve for most of the rest of this decade, no matter how this specific episode ends. That is not too negative of an interpretation. After supply shocks of this size, history has taught us this lesson over and over again. The crisis's acute phase may end, physical flows may partially recover, and volatility may go down from extreme levels. However, the market that comes out of the crisis is rarely the same as the one that existed before the crisis. The most important thing for investors, traders, and risk managers to know is that the question is no longer how quickly the shock goes away, but how long geopolitical instability stays in energy markets.