
Several key factors have contributed to the recent market downturn, as outlined below.
The U.S. recently announced a 25% tariff on imported vehicles, sparking concerns about a potential trade war. This has already caused a decline in global auto stocks, as manufacturers anticipate higher production costs and U.S. consumers face the likelihood of rising prices.Combined with broader economic uncertainty, these tensions have led investors to pull back from U.S. equities.
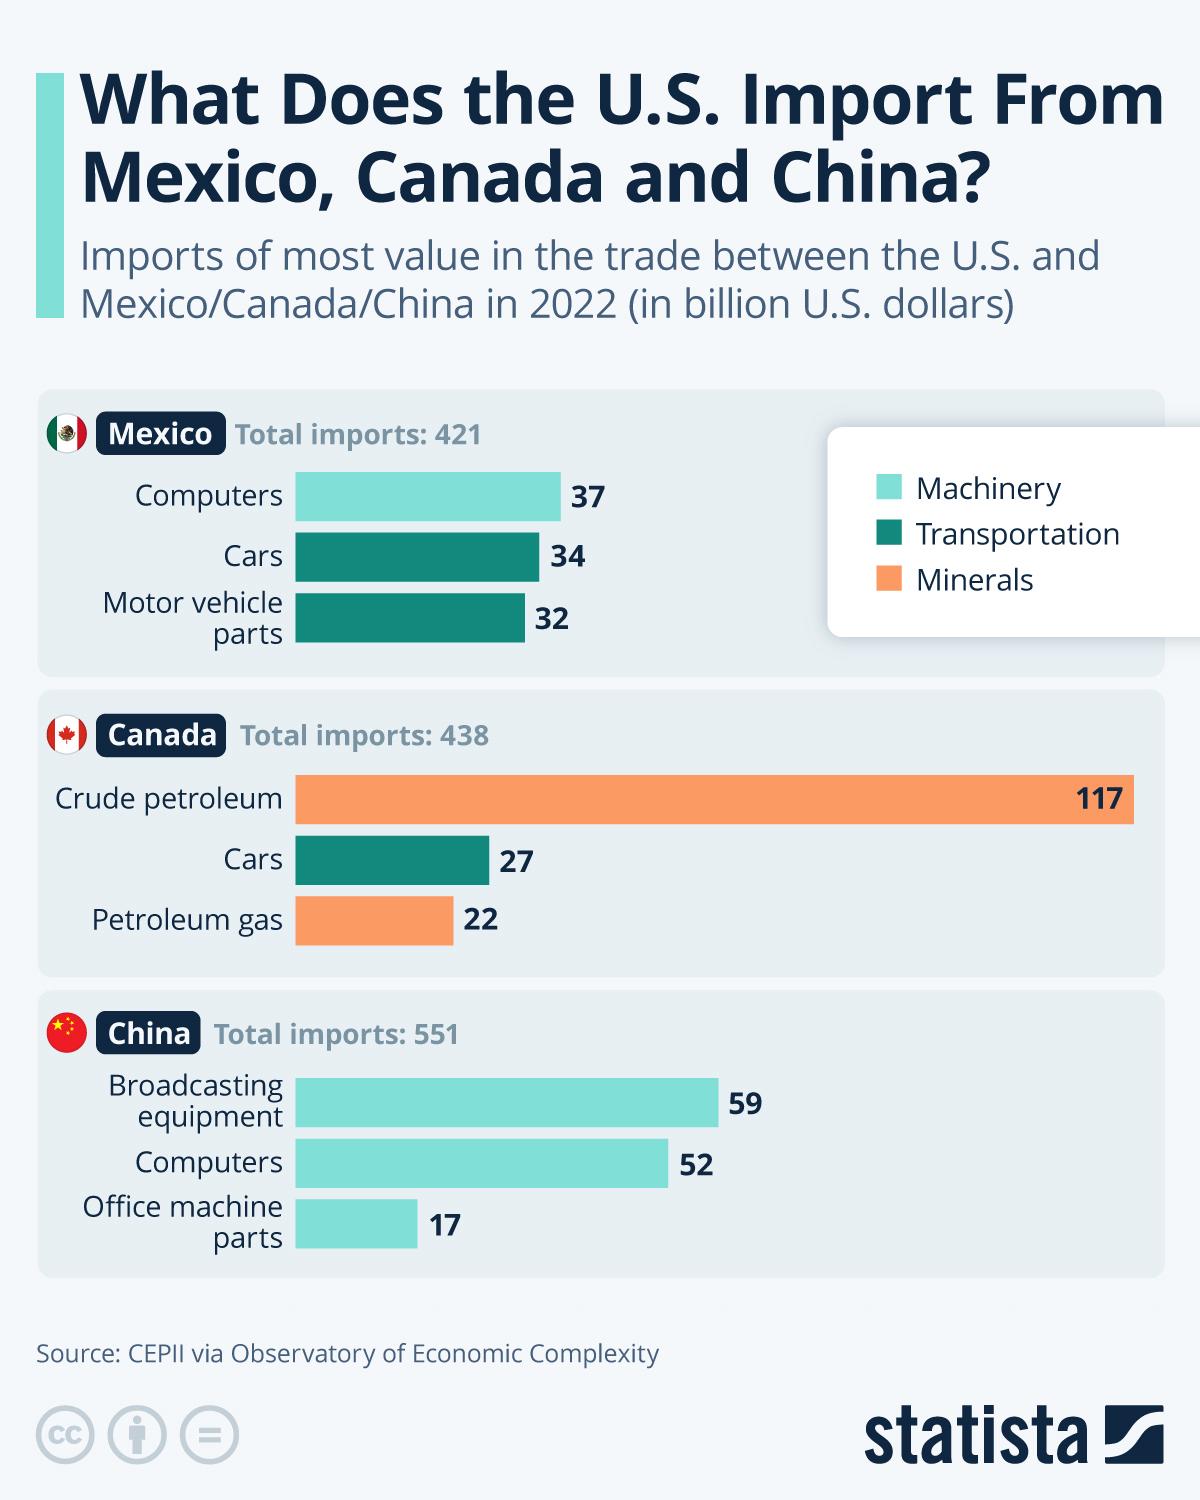
Canada & Mexico: On March 4, 2025, President Trump shook global markets by imposing a 25% tariff on all Canadian and Mexican exports to the U.S. with the exception of Canadian energy resources and minerals, which face only a 10% tariff. Interestingly, despite the significant differences in their economies’ size, production, and consumption, Canada and Mexico have been subjected to nearly identical tariff measures. Is this a deliberately bold statement by Trump, or a miscalculation driven by lack of understanding?
China: The 20% tariffs on Chinese goods remain a hot topic. Some speculate that Elon Musk’s influence on Trump may have played a role in sharply raising tariffs on Chinese electric vehicles entering the U.S. Was this a mere coincidence, or a calculated strategic move by theTrump administration?
USA: On March 12, the United States imposed tariffs of up to 25% on imports of steel, aluminium, and certain products containing these materials from the European Union (European Commission, 2025). Reciprocal tariffs are expected to follow on both sides. To put this into perspective, “The U.S. tariffs will affect a total of €26 billion in EU exports, representing approximately 5% of the EU’s total goods exports to the U.S.” And this is even before any reciprocal measures are applied. “Based on current import flows, U.S. importers will face up to €6 billion in additional import tariffs” (European Commission, 2025; Reuters, 2025).
The outcome? It’s bad news for consumers, producers - really, for everyone involved.
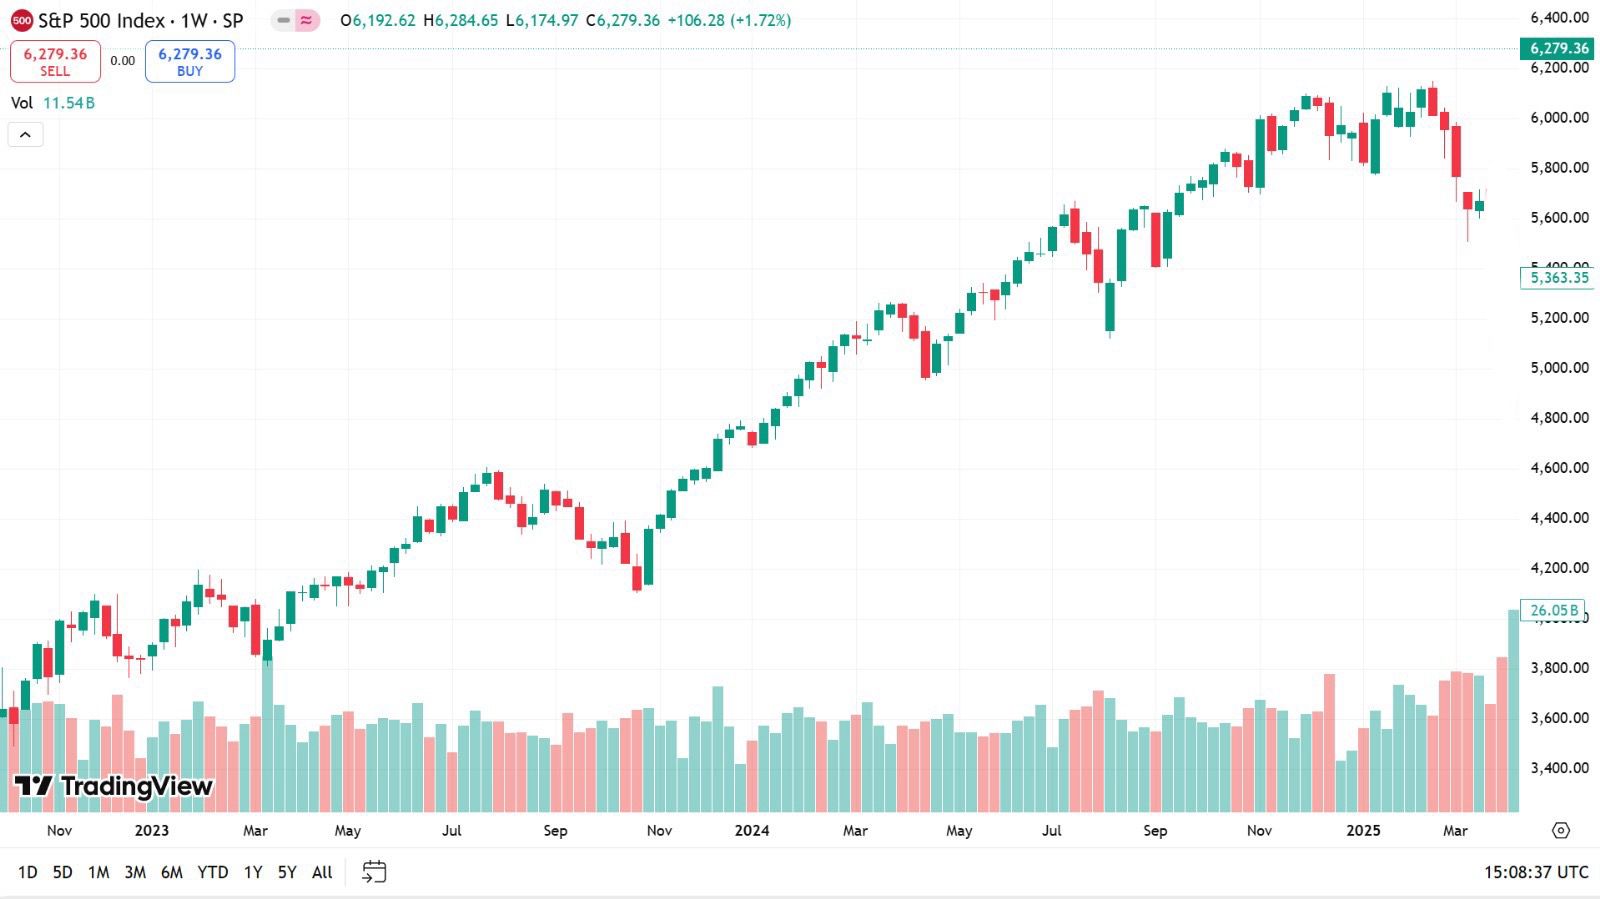
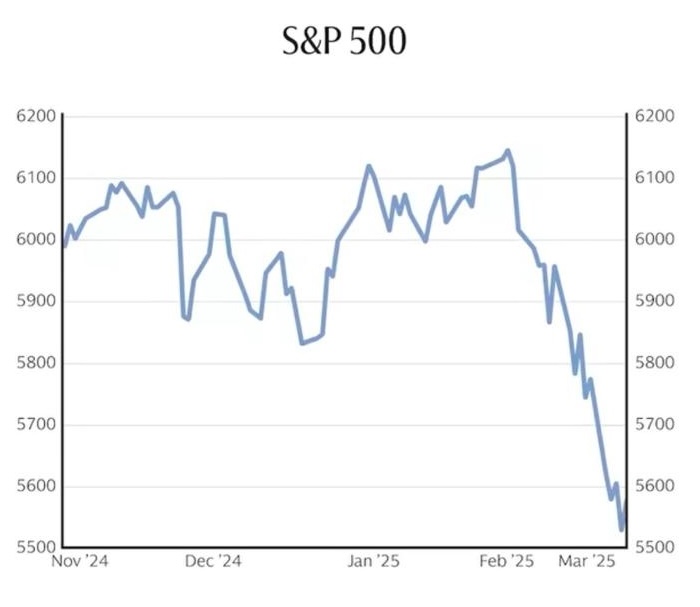
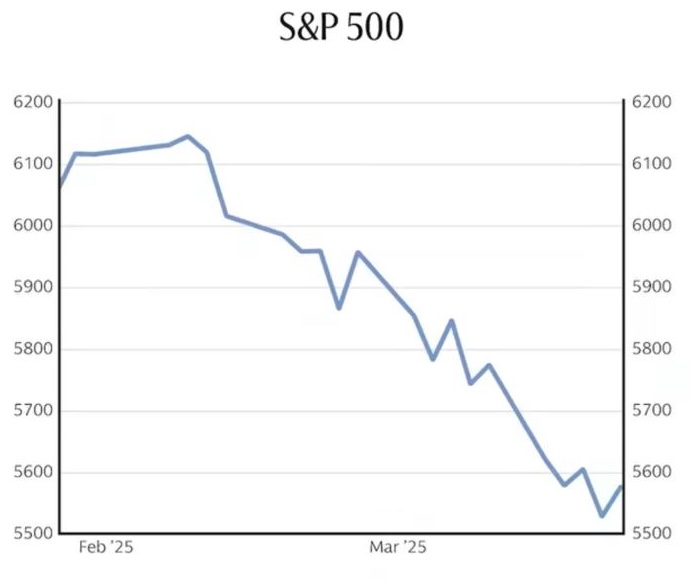
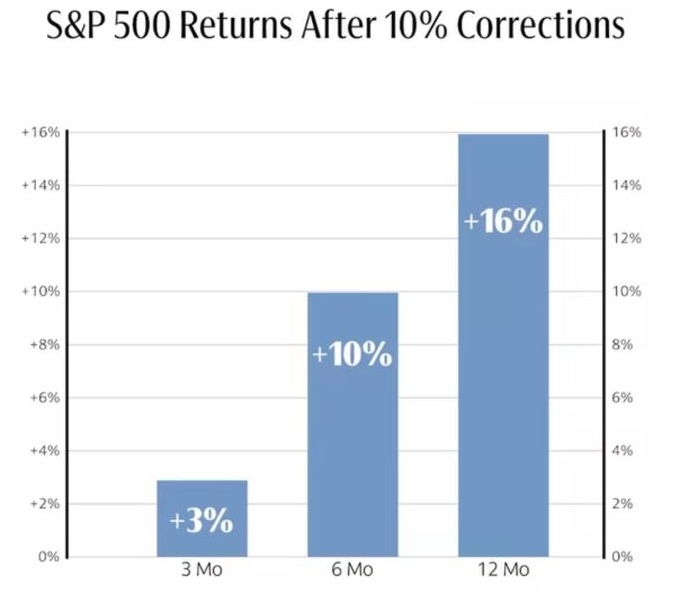
Brad Setser of the Council on Foreign Relations predicts that these tariffs and other economic pressures could significantly slow U.S. GDP growth in the next quarter (MarketWatch, 2025). The Federal Reserve has also signalled concerns about weakening demand in certain sectors. Beyond the forecasts of prominent economists, technical market indicators are raising red flags as well. Notably, the S&P 500 recently dipped below its 200-day moving average: “a key indicator that many traders use to determine market momentum” (MarketWatch, 2025). This suggests that further downward pressure on stocks may be expected.
However, it’s important to note that this perspective is based solely on historical data and should be interpreted with caution. As the saying goes, history doesn’t repeat itself, but it often rhymes. Still, one must ask: when was the last time a major tariff war erupted? Is historical data even a reliable guide in today’s unprecedented context? What do you think?
However, it’s important to note that this perspective is based solely on historical data and should be interpreted with caution. As the saying goes, history doesn’t repeat itself, but it often rhymes. Still, one must ask: when was the last time a major tariff war erupted? Is historical data even a reliable guide in today’s unprecedented context? What do you think?
Consumer confidence has dropped sharply, as reflected by the slowdown in retail sales growth; a clear sign that people are cutting back on spending. The luxury market, in particular, has shown signs of weakness, with major brands preparing for a potential downturn. Historically, when consumers reduce spending on luxury goods and nonessentials, it often signals a broader economic slowdown. This is concerning for investors because consumer spending accounts for nearly 70% of U.S. GDP, meaning a decline in demand could trigger widespread economic consequences.
Today’s stock market is heavily dominated by technology giants known as the “Magnificent Seven”: Apple, Microsoft, NVIDIA, Amazon, Meta, Alphabet, and Tesla. Their combined market capitalisation now makes up a larger share of the S&P 500 than was seen even during the Dot-Com Bubble. This creates a massive concentration of capital in just a few stocks, which some argue has led to an “artificially” elevated market.
Let’s look at the technical details:
Importantly, unlike the Dot-Com era’s Four Horsemen, which had little profit and limited operational history today’s Magnificent Seven are established, highly profitable firms, not merely fuelled by speculative investment.
Overall, there are valuable comparisons to be made between each era and the companies leading the market in both time periods. However, the circumstances today are so different that drawing a simple conclusion is difficult. I would argue this isn’t another Dot-Com bubble, but it is another correction. A major correction that is opening the eyes of investors around the world. Unlike in 2001, today’s market also faces global trade disputes and inflation concerns. The environments are different, and that’s why the outcomes will be different too. In my opinion, the U.S. will emerge from this correction and continue making strides forward. Profitable and reliable companies are leading the way, supported by long-term investors who understand that the Dot-Com bubble was driven by speculation and poor risk management. This is not another Dot-Com bubble; it is, although significant, a correction and that’s all it will be, as long as economic uncertainty doesn’t escalate further (Finbold, 2025).
So, to answer our first question: why are U.S. stocks performing so poorly?
First, tariffs. The number one most important factor. Widespread, aggressive, and reciprocal tariffs are causing serious trouble.
Second, economic slowdown and falling demand. Third, an overvalued U.S. market has led traders to seek undervalued alternative investments; they’ve been finding hedges all around the world to park their money in. Copper, for example, recently reached an all-time high.
In conclusion, U.S. stocks are underperforming and we don’t know for how much longer. My guess is that until tariff policies are firmly established, we will continue to see ongoing problems for U.S. stocks.
