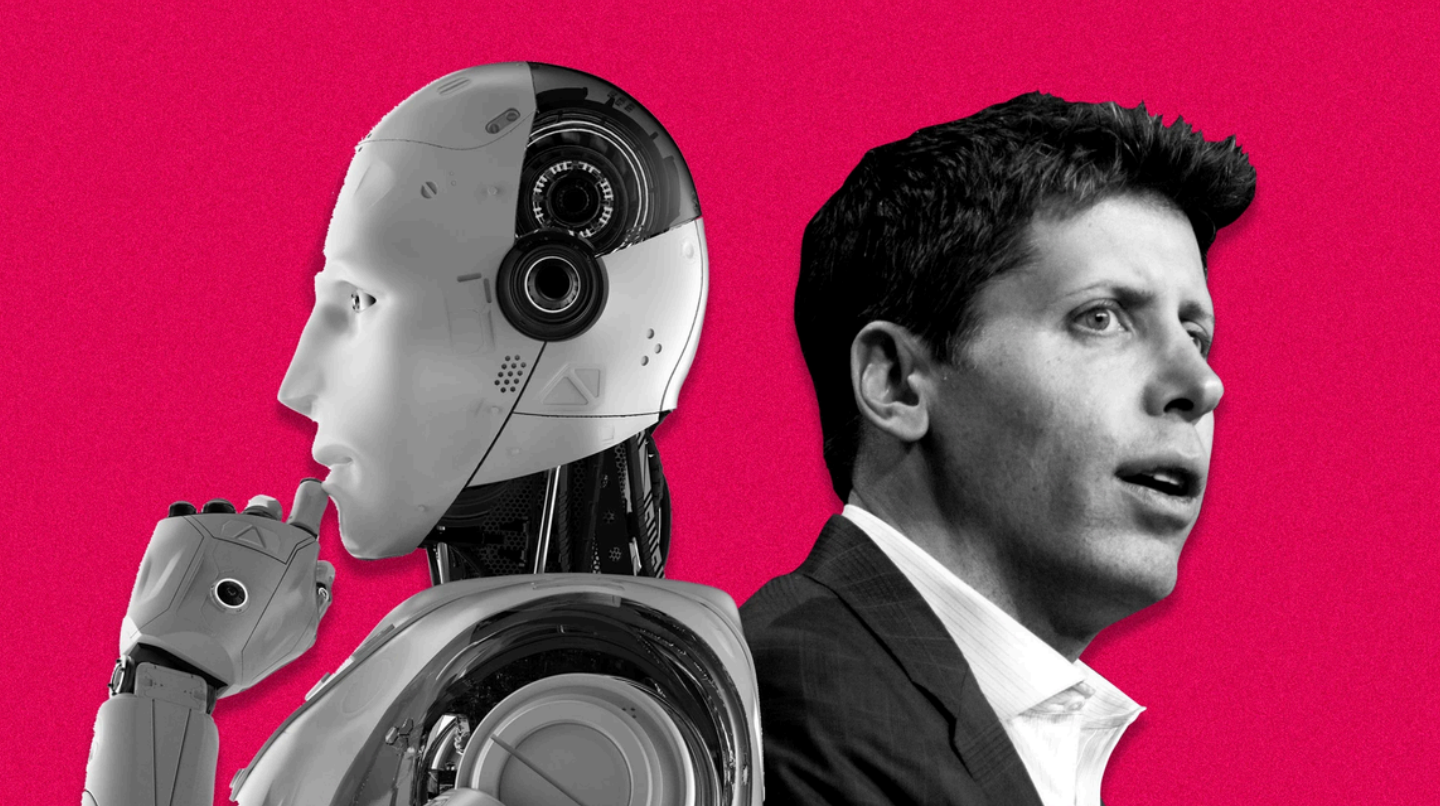
Media and commentary claims that AI is currently in a ‘bubble’ have been more prevalent than ever. Recent sell offs of Nasdaq and S&P indices have been prompted by an MIT study that 95% of AI startups were generating no return on investment. Even Sam Altman’s, CEO of OpenAI, claims that investors are going to “lose a lot of money” are driving investor scepticism.
But are we in a ‘bubble’, a prolonged level of unsustainable asset price inflation that may correct, just like the dot-com crash of 2000?
In this report, I compare corporate behaviour from before the dot-com crash in 2000 and now, to investigate whether there are any patterns that point towards a similar outcome. After looking at general indicators for a tech bubble, I will analyse corporate behaviour such as IPOs and equity financing, M&A activity and insider trading between the pre-2000 crash and nowadays.

Firstly, we must establish the common indicators that point toward an AI bubble right now.
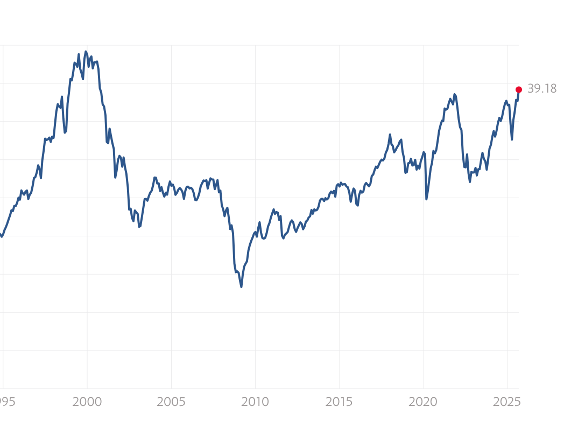
AI could simply be over-valued, which is typical for any rapidly advancing technology. Carlota Perez, author of the Technological Revolutions and Financial Capital: The Dynamics of Bubbles and Golden Ages, claims that AI is an extension of our 5th technological revolution. By analysing revolutions through history, she found that they follow fairly predictable cycles. The ‘first installation phase’ results in lots of creative destruction accompanied by over-investment and bubbles, which is beneficial for funding and rapid progress (John Thornhill, 2025). Shiller’s CAPE ratio, a metric that divides the current market price by the average inflation adjusted earnings per share, is currently approaching 39, approaching the 2000 peak. This demonstrates that while there is an overvaluation, these bubbles are necessary as Perez mentions, "I have not seen a golden age happening without a crash", just a hurdle towards a full-on AI revolution.
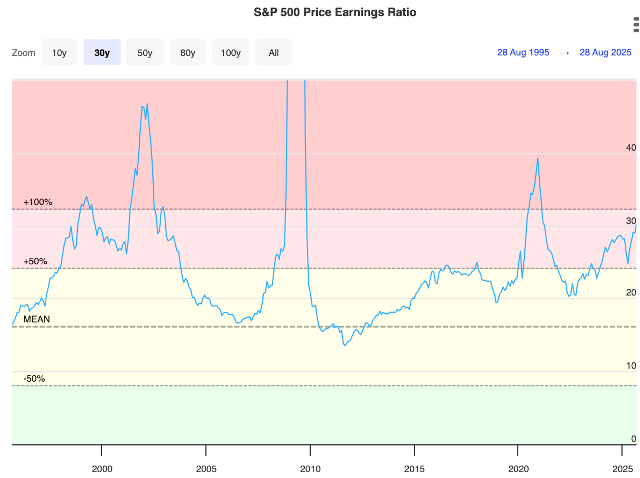
However, other indicators seem very tame compared to the 2000 crash. The forward PE ratio for the Nasdaq as of August 2025 is 27, miles away from the 2000s peak of around 200. While there are other concerns such as market concentration which increases the risk of overvaluation, the Magnificent 7 now accounting for around 34% of S&P 500, most indicators point towards a mild overvaluation rather than an impending crash.
The idea, though, of the progress of AI slowing down has really spooked investors. FT writer Tim Bradshaw argues that AI is hitting a ‘wall’ due to the disappointing introduction of ChatGPT-5 as a “significant step along the path to AGI” whilst being plagued by basic mistakes. As the Magnificent 7 are investing huge amounts into AI infrastructure and AI is accounting for 33% of venture capitalist investment this year, any slowdown in AI technology is bound to worry investors and question the advancement of AI (Tim Bradshaw, 2025).
So, does Sam Altman’s claim really hold up? While it is true that evidence of slowdowns and over-valuations combined with the MIT study create a strong argument for a bubble, many valuation metrics (e.g. the CAPE ratio) are more reflective of elevated optimism and overvaluation; optimism which is being tested at the moment.

In short, corporate behaviour was manic and somewhat delusional. Investors were blinded by the prospect of a ‘new economy’, creating large demand for any company tagged ‘.com’, and as media perpetuated this white lie, momentum and herd behaviour generated its own returns.
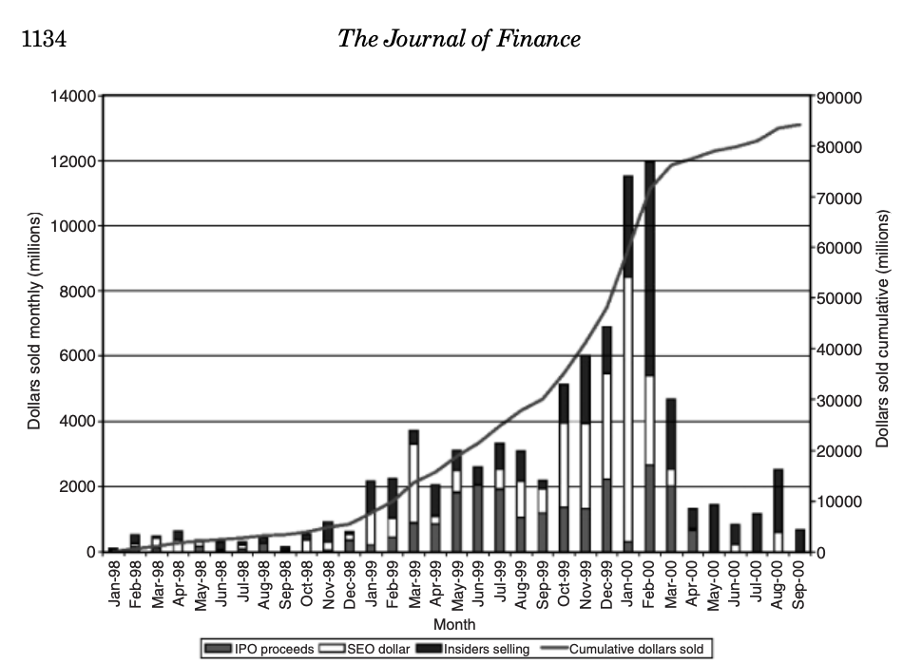
One aspect of the bubble was caused by what’s deemed ‘IPO Mania’; IPO first day average returns were unprecedented, 89% for internet companies. Ljungqvist & Wilhelm (2003) argue that this was not only due to delusional investors, but a change in incentive and equity allocation, insider ownership became more fragmented, which weakened the incentive of the pre-IPO decision makers to fight underpricing.
Underpricing is when a company sets its IPO share price below actual market value, resulting in a spike in price on the first day of trading, helping signal high interest to investors. Therefore, executives who own large shares of the company would lose money from underpricing, meaning they push for a higher offer price. So, if there is less internal equity allocated to executives post-IPO, they have less to lose from underpricing, hence having weaker bargaining power to fight for a higher price. This contributed to the extreme underpricing characteristic of ‘IPO mania’, benefitting underwriters and investors alike. The huge surge in IPO and Seasonal Equity Offerings (SEO) is demonstrated in the graph below.
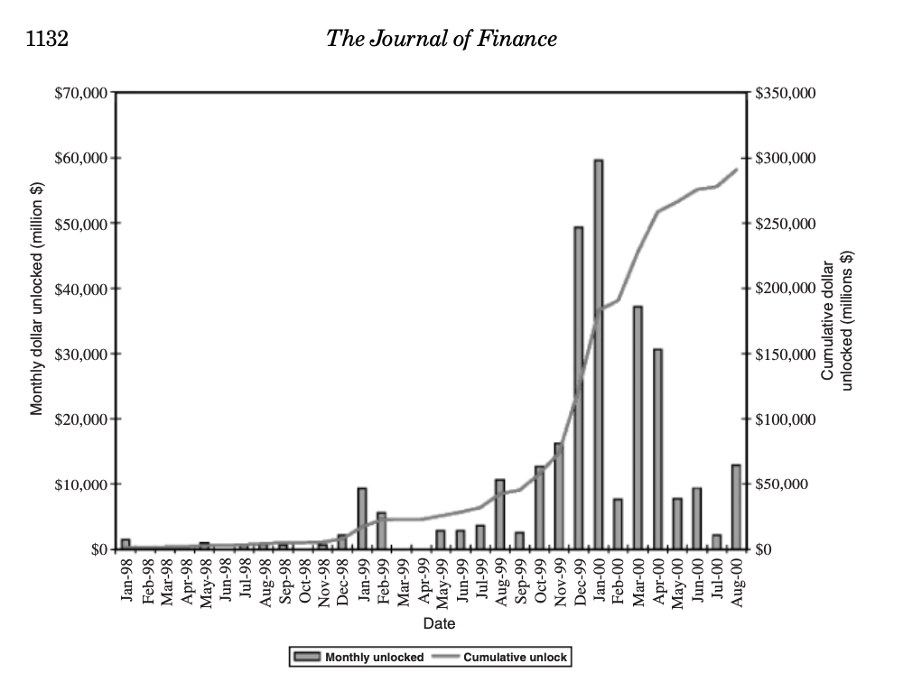
Insider behaviour shows really distinctive patterns during the bubble. Many dot-com IPOs had lockups (an agreement not to sell IPO shares) in a concentrated time frame, helping maintain an artificially high price. When these expired, they created predictable supply shocks, which drove prices down. Ofek & Richardson (2001) link these restrictions of supply to dictated prices, and contributed to the later collapse of Internet stocks. The huge inflow of released shares is shown in the figure below.
Aggressive growth and deal finding defined the era. M&A tech deals doubled from 1998 to 2000, financed with overvalued stocks. A surge in M&A activity signals firms have cheap market capital to buy growth quickly, often with stock acquisition deals, instead of creating it via profitable operations. Using equity as currency is a clear indication of an overvaluation.
We can conclude that firm behaviour during the Dot-Com bubble was erratic: issuing equity aggressively, pursuing deals and growth relentlessly, all under the veil of optimism, proved to be costly.
So, are we seeing the same patterns in corporate behaviour? Well, M&A activity is much more active, with many strong deals occurring this year, e.g. Meta acquired 49% of Scale AI for $14.8 billion and hired its CEO, AI startup deals rose 53% and 288% respectively in 2024. Samuel Kerr, head of equity capital markets at Mergermarket, argues this is a normal trend of maturity, as larger companies absorb smaller companies’ technologies rather than building their own. While, back in 2000, M&A activity was driven by cheap, overvalued equity, nowadays they are more representative of a strategic urgency for AI technology, driven by rich tech giants reflecting a chase for value, not speculation (PYMTS, 2025).
This leads me onto the main differential, strong and consistent corporate earnings, such as the Magnificent 7, have maintained the foundation of AI optimism, despite many startups remaining unprofitable. This huge profitability, combined with cautious liquidity management, has led companies to emphasise capital discipline, rather than recklessly expand, e.g. Nvidia’s cash hoard doubled to $35 billion by late 2024.
The mechanisms of insider behaviour in 2000, that facilitated speculation and supply constraints, are still present. Lockups still exist, and data shows that insiders are still net sellers at peaks.
However, private secondary markets and crossover investors (e.g. mutual funds or pension funds who invest as the company crosses between private and public) help raise capital for insiders before the public IPO. This means insider selling is less important to raise capital, meaning, on the surface, IPOs seem tamer. This does not discount the possibility of large sell offs, which were present just before the 2000 crash.
Underpricing still remains; Elliot (2023) found that IPO offer prices are about 12% lower than estimated maximum offer prices, on average. However, the growth of institutional anchor investors (e.g. pension funds, mutual funds or hedge funds), who agree to buy large chunks of shares before the IPO, reduces uncertainty about demand and therefore reduces the need to deliberately reduce prices to attract investors. Furthermore, alternate methods of going public, such as a direct listing, eliminate the need for an underwriter allocating shares; prices are driven by market forces. While this may increase volatility in the short term, there is no underpricing motive. Therefore, while underpricing still exists, its effect is largely dampened compared to the 2000 peak.
IPO volumes have been relatively strong, despite Trump’s tariffs and geopolitical uncertainty, though they are nowhere near the heights seen during the 2000s. There were 225 IPOs in 2024, and 229 so far in 2025, demonstrating a more restrained equity issuance. However, IPO volume alone does not reliably indicate bubble like behaviour.
While many potentially dangerous internal mechanisms still remain, it seems firms have learnt their lesson from 2000 as corporate behaviour seems much more stable. While this doesn’t discount the chance of this behaviour reviving, it does make the prospect of a bubble far less likely.
Based on this investigation, we can see there is no specific pointer towards a bubble at this point in time. Fundamentally, many indicators point towards an era of cautious optimism; investors realise that AI technology remains the engine for future productivity and innovation, however, are conscious of the repercussions of the blind optimism that resulted in the crash in 2000. While the recent studies of poor ROI and Sam Altman’s comments are recent drivers of scepticism, the fundamental strength of AI suggests that the previously bullish expectations of investors are starting to conflate.
This exercise of comparing corporate behaviour may also be obsolete, firms may simply be exhibiting completely new signs that indicate a bubble that we haven’t yet spotted. Despite this, it’s still interesting to demonstrate the progression of how this behaviour has, not surprisingly, been completely solved, the mechanisms to produce another bubble are in place.
It’s interesting to take a view of this AI era holistically, following the historical phases of what usually occurs when humanity adopts new technology. Perez argues that bubbles are symptomatic of the ‘initial installation phase’, so, instead of fearing the bubble, embrace the bubble as a natural progression of innovation until we see the ‘golden age of AI’.